 gapminder.jpg" style="border: medium none ; display: block;" width="240" height="169">Image by guspim via Flickr
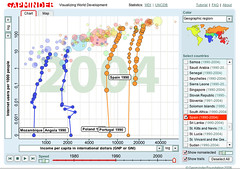
I have blogged about gapminder before - a great way to visualize data over time. Only problem is is that the information is still very dense, plus you have to be online to access this application.
So for a different application try StatPlanet. You can use it online or there is a download version as well. It only looks at 2000 and 2005 data, but maps it out on world and regional maps. the statistics are from the same place as Gapminder - UNESCO.
You can also down load software to make your own maps and charts with your own data.
This is great for both mathematics and Society and environment. It work well on an IWB as well so great for introducing a topic or statistics.


 Reblog this post [with Zemanta]">